Now that I've got Prometheus and Grafana all set up to pull in metrics from Proxmox, I figured it might be cool to pull in all the data from the UniFi gear too.
These instructions assume you already have Prometheus and Grafana set up and running. If not, you can read about that setup here.
I'm going to set up the UniFi Poller on the same LXC container I'm running prometheus-pve-exporter on. So this container will just be the one that pulls in all the data from different places. Once that's set up I'll configure my Prometheus container to pull in the new UniFi stuff and Grafana is already set up so it should just be ready to go.
Before starting, create a new user in the UniFiOS and give it the View Only role.
Setup UniFi Poller
Log in to the container Prometheus will pull from
Download and install UniFi Poller
curl -s https://golift.io/repo.sh | sudo bash -s - unpoller
Edit the config file
nano /etc/unpoller/up.conf
Set disable = true in the InfluxDB section
Change the url in the [unifi] section to the IP address of UniFiOS 192.168.X.X and remove the colon and port
Change the user to the view-only user that you created earlier
Save and exit
Prometheus config
Log in to the Prometheus container and edit the config file
nano /etc/prometheus/prometheus.yml
After the last entry in scrape_configs add:
  - job_name: 'unifi'
    static_configs:
      - targets: ["192.168.X.X:9130"] # The IP address of the container running UniPoll
Restart Prometheus
systemctl restart prometheus
Grafana
Install Grafana plugins
Log in to the container running Grafana and install the plugins needed
grafana-cli plugins install grafana-clock-panel
grafana-cli plugins install natel-discrete-panel
grafana-cli plugins install grafana-piechart-panel
Restart Grafana
systemctl restart grafana-server.service
Add UniFi dashboards to Grafana
- Open up Grafana in the browser
- Click the Dashboards option from the left menu and select "+ Import"
- In the textfield labeled "Import via grafana.com"
- Enter in any of the UniPoller Prometheus dashboards listed below
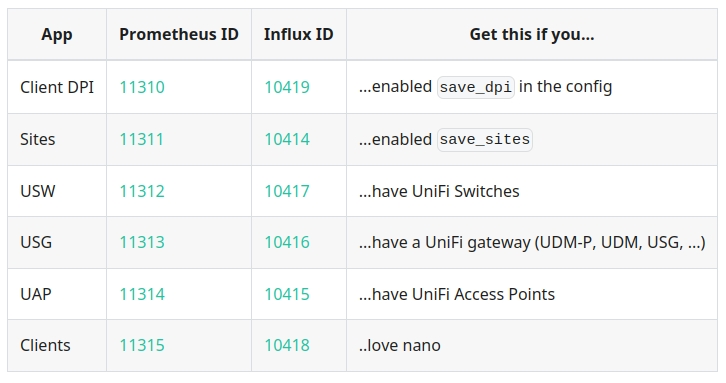
I mainly just look at the Clients one, but it's nice to have the Sites and Client DPI ones too sometimes.
References: